No Correlation Between Democracy and Forest Governance
As UN negotiators scramble to develop a global mechanism for generating carbon credits by saving rainforests, individual countries are moving ahead with their own plans. Research published last year, however, shows that most of those plans are woefully out of synch with each other – a fact that could have dire consequences for the development of a truly global carbon market.

As UN negotiators scramble to develop a global mechanism for generating carbon credits by saving rainforests, individual countries are moving ahead with their own plans. Research published last year, however, shows that most of those plans are woefully out of synch with each other – a fact that could have dire consequences for the development of a truly global carbon market.
14 February 2011 | All markets differ from region to region. Soybean meal from Brazil, for example, has a higher protein content than does soybean meal from the United States, which makes it especially popular in China. But the two products resemble each other enough that a Chinese buyer will grudgingly accept the latter in lieu of the former – albeit at an agreed upon discount.
That’s one of the things that makes soybean meal a commodity‘, and its status as a commodity is one of the things that makes it so easy to trade.
Carbon offsets aren’t much different: to work, they need to be commoditized and traded across jurisdictions. That’s especially true of offsets that slow climate change by saving rainforests and reducing greenhouse gas emissions from deforestation and forest degradation (REDD). It is only when offsets follow the same rules around the world that an emitter in Chicago can offset his footprint by saving rainforest in Brazil, Columbia, and Kenya.
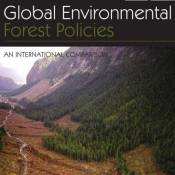
Constance L. McDermott, Benjamin Cashore, and Peter Kanowski offer disturbing evidence that this isn’t happening. In Global Environmental Forest Policies: An International Comparison, published last year, they have provided the first concise, systematic approach to analyzing the global diverse forest management landscape.
The 22 figures in Chapter Two alone (Selection and Global Context of the Case Study Countries) should be required reading for anyone interested in forest management for production, protection or both.
Setting the Scene
Forest management policies can be opaque and confusing, and when increased interest internationally is developing for a global UN REDD+ framework that includes both the private and public sector, maybe UN negotiators and the general public can learn from framework used by the authors. The authors eloquently define forest management policies in four categories:
- Procedural with suggested planning processes.
- Procedural with mandatory planning requirements.
- Substantive with suggested performance measures.
- Substantive with prescribed performance requirements.
This framework allows for a general comparison between leading countries that are involved in both forest products manufacturing and forest raw materials production.
Wide Policy Disparities
Questions arise even within countries, like why is less than 5% of SE US forests in IUCN Categories I – VI protected forests? Further gap analysis also demonstrates disparity between regions, leading to question like why does Eurasia and Africa have the smallest percentage of protected forests, while Australasia and the Neotropics have the greatest percentage? Also, how forestland is designated provides general contextual comparison opportunities. For example, why does Japan have 0% of its forests designated as protected for conservation?
In the Fine Print
As the authors further narrow down their analysis, remarkable data points come to the surface which may reflect misapplication of global forest management policies. For example, in regards to riparian buffer zones – the most prescriptive of all the policies analyzed – clearly strange bedfellows arise with the DRC, Mexico, and Indonesia as they all have the same prescriptive riparian buffer management policy for a specific stream type regardless of stream sizes. Even more remarkable is the fact that developed countries, in general, have fewer prescriptive nominal requirements for riparian buffers than developing countries. Even in forest road culvert size at stream crossings and road abandonment, there are greater similarities between Chile and the DRC and US policy regarding voluntary procedures for the SE states than between the western and eastern US states.
What Does this Mean for REDD+?
The devil’s in the details regarding the key takeaways from Global Environmental Forest Policies, and considering how REDD+ will be enacted. While much is made of the constant chatter surrounding REDD+ and community property and indigenous rights, it might also be suggested that the policies surrounding REDD+ regarding forest management pursue ecologically sound and consistent criteria. You learn from the excellent comparative analysis in this book that one size does not fit all.
Please see our Reprint Guidelines for details on republishing our articles.

