Now Available: CORSIA Carbon Market Data from Ecosystem MarketplaceICAO Environment CORSIA Newsletter
Following the announcement of the ICAO-EM partnership, Ecosystem Marketplace will publish updated data monthly on CORSIA-eligible carbon credit prices.

1 December 2021 | Today’s edition of the CORSIA newsletter marks the first publishing of data on carbon market transactions of CORSIA-eligible emissions units, following the August 2021 announcement on the ICAO-EM partnership (Ecosystem Marketplace (EM) is a non-profit initiative of Forest Trends). The information presented by EM here aims to enhance States’ and stakeholders’ understanding of the development of carbon markets, and to help States to better understand the effects of CORSIA on the international aviation sector.
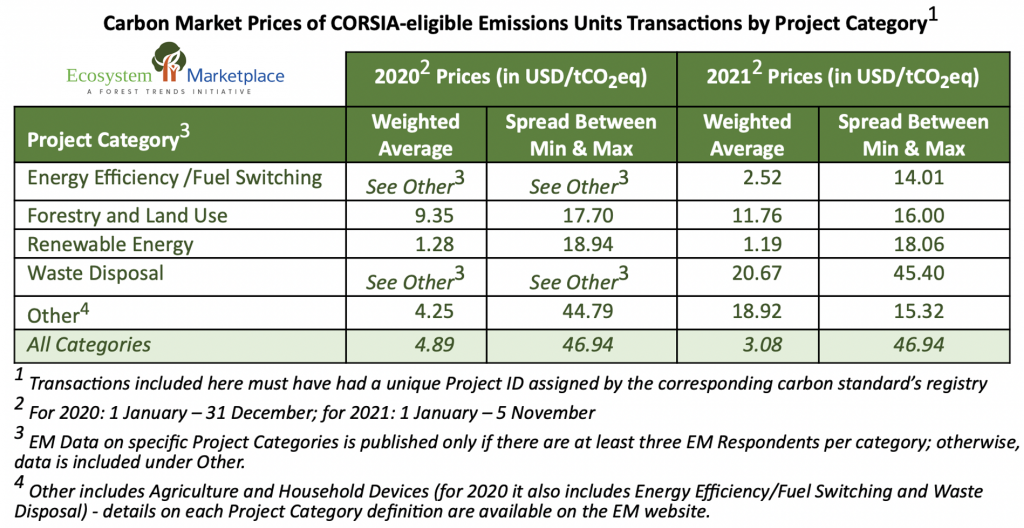
EM has aggregated and anonymized reported carbon market transactions of CORSIA-eligible emissions units for 2020 and 2021 YTD. Information encompasses transactions as of 5 November 2021 from American Carbon Registry (ACR), Clean Development Mechanism (CDM), Climate Action Reserve (CAR), Gold Standard (GS), and Verra. In the table below, EM has provided annual summaries and totals for project categories derived from projects located in 17 countries in the geographic regions of Africa, Asia, Europe, Latin America and Caribbean, and North America.
When comparing the transaction periods of 2020 (1 January – 31 December) and 2021 YTD (1 January – 5 November), buyers have paid significantly different prices for CORSIA-eligible units ranging from less than USD 0.50/tCO2eq to more than USD 45.00/tCO2eq. The weighted average price for All Categories has dropped from USD 4.89/tCO2eq in 2020 to USD 3.08/tCO2eq in 2021 YTD. This drop is mostly attributed to an increased number of transactions of lower-priced Renewable Energy units in 2021 YTD. The weighted average price of CORSIA eligible Forestry and Land Use units has increased by about 26% between 2020 and 2021 YTD. This group of projects includes Improved Forest Management, Afforestation, and Reforestation. The shift in price was mostly driven by Improved Forest Management, the average price of which jumped by about 53%. More details can be found on the EM website.
As EM Respondents continue to report trade data to Ecosystem Marketplace, updated prices will be included in future editions of this newsletter.
View the data in EM’s Data Intelligence and Analytics Dashboard.
Please see our Reprint Guidelines for details on republishing our articles.


