Can “Radical Transparency” Save Forests And Slow Climate Change?
If a Trump presidency neuters the US federal government’s efforts to combat climate change, as many expect, then “non-state” actors like cities and companies – as well as consumers and watchdogs – must fill the gap. A new platform called “Trase” aims to help, by introducing “radical transparency” to global supply chains.
1 December 2016 | Kevin Rabinovitch stands straight and speaks in clear, clipped tones – more like a naval officer than a corporate quant – as, on the screen behind him, a daunting mass of threads and whorls illustrates the global flows of Brazilian soybeans from thousands of individual municipalities across Brazil, through specific exporters and importers, to countries around the world.
“We buy a lot of soy from Brazil,” he says. “But we also buy things that eat soy in Brazil before we buy them,” he continues, referring to the chickens and cows that end up in pet food manufactured by food giant Mars Inc, where he’s Global Director of Sustainability.
Known for its ubiquitous Mars and Milky Way candy bars, privately-held Mars, Inc also makes Whiskas cat food, Wrigley’s chewing gum, and dozens of other products that require tens of thousands of tons of cattle, soy, and palm oil – all of which are packaged in products derived from pulp & paper.
These are the “big four” commodities responsible for most of the world’s deforestation, and they achieved that status because thousands of companies buy them from hundreds of thousands of farmers around the world, and many of those farmers chop forests to make way for plantations.
But a relative handful of companies have been acting more like environmental groups than for-profit entities, largely because unsustainable agriculture means unsustainable business. Mars, for example, recently teamed up with Danone to launch the Livelihoods Funds, which invest in sustainable small-scale farms around the world, and it’s one of 56 companies to endorse the New York Declaration on Forests (NYDF), which aims, among other things, to purge deforestation “from the production of agricultural commodities such as palm oil, soy, paper, and beef products by no later than 2020.”
Even before endorsing the NYDF, Mars had established concrete goals for improving the way it gathers raw materials, and it set tight deadlines for achieving them. Now it’s reporting solid progress on two of them: the Forest Trends Supply Change project shows Mars reporting it is 91% of the way towards achieving its palm oil goal and 89% of the way towards achieving its packaging goal.
But the company hasn’t yet publicly reported progress on its soy or cattle pledges, both of which have 2017 due dates, and Rabinovitch says the task is proving more difficult than he and most corporate sustainability directors imagined.
“Privately amongst ourselves – and even publicly in forums – there’s a lot of head-scratching that goes on,” he says. “We know we want to end deforestation, but it’s not obvious how we’re going to do it, and it’s critically important to have the data community step up and say, ‘Here are tools that can help you.’”
That massive blob on the wall behind him could be one of those tools (see “How it Works”, below).
Trasing the Globe
It’s called “Trase”, which stands for “TRAnsparence for Sustainable Economies”, and was developed jointly over the past two years by the Global Canopy Programme (GCP), the Stockholm Environment Institute (SEI), and the European Forest Institute (EFI).
It’s designed to help companies and watchdogs track the impact that the purchases in one part of the world are having on the ground in other parts, and it works by tracking soybeans from every Brazilian municipality that produces them – more than 2,000 in total – through brokers, exporters, and importers, and then providing an overlay to compare the supply chain with environmental conditions in the municipality of origin.
“Traders tell us that they need to be able to filter the threats and opportunities quickly to be able to prioritize those places – and the other actors associated with those places – where they need to be acting first, and with the highest priority,” says Toby Gardner, an SEI Research Fellow who demonstrated the portal at year-end climate talks in Marrakesh, Morocco.
The demonstration came just days before Climate Focus presented an assessment report consolidating data from 12 transparency initiatives, including Supply Change and GCP’s Forest 500, as well as interviews with corporate sustainability officers, finding a disturbing lack of transparency around progress among NYDF companies.
Further Coverage on Bionic Planet
Scroll down to continue reading, but be sure to get more details on the latest episode of Bionic Planet, which is available on iTunes, TuneIn, Stitcher, and elsewhere. The latest episode features extended interviews with the team that developed Trase, as well as a walk-through of the platform.
Tedious Research; Simple Interface
Trase lets users view both a supply-chain map and a geographical map, and the data driving it was cobbled together over two years using bills of lading, customs declarations, and other documents generated in the harvesting and transport of soybeans. Many were purchased from trade intelligence companies.
“Tellingly, this is data that already existed, but it was not tapped by the sustainability community,” says Gardner. “We were looked upon with bemused astonishment when we approached trade intelligence companies to use these, and I wonder how many other useful sources are out there just waiting to be tapped.”
They plan to expand the portal to include other Latin American countries, then to facilities that crush soybeans into meal and oil, as well to feedlots that turn soybeans into chickens and beef, and finally to the other big four commodities. Internally, they assign confidence ratings to many of the “threads” in the supply-chain map, which is constantly being improved through site-specific research.
“If a company declares that they have a production farm in a given municipality, that’s something we can take into account,” says Clément Suavet, who lead development of the platform. “As we gain more information, we can add certainty incrementally, and we would like to make this available on the site as well.”
Yin and Yang
The platform is designed to blend with others that show different parts of the supply-chain puzzle. Trase, for example, ends at the port of import, which means it doesn’t yet show end retailers and manufacturers. Supply Change, on the other hand, begins with end retailers and manufacturers, as well as brokers.
“Each of our platforms are tackling different parts of the puzzle, and there are many others coming at it from other angles as well – from supply chains transparency and data collection tools such as CDP Forests Program to the sustainable commodity certification agencies such as RTRS and RSPO,” says Stephen Donofrio, Supply Change’s Senior Advisor. “As Supply Change relies solely on self-reported commitment declarations and progress updates, then in a sense, Trase compliments this in that it could provide a ground-truthing, or spot check, against what companies are saying in their own documentation.”
Rabinovitch says that, as more entities shine more transparency on supply chains, good companies will be more willing to show their cards, leading to virtuous cycle of more and more disclosure.
“The default mindset of corporate entities is, ‘If I share data, something bad could happen; someone could figure out something about my business,’” he says. “But as soon as a number is out there, a customer or supplier says, ‘I’m assuming that number applies to you, because Trase says it’s the deforestation number of companies in your country,’ so good actors now have a motivation to say, ‘Whoa, hang on. Disaggregate us from that lot. These are our numbers,’”
Thomas Sembres works with the UN REDD Facility and EFI. He contributed to the platform’s development and sees such tools providing support to cash-strapped regulators, and cites the European Union’s long development of the Forest Law Enforcement, Governance and Trade (FLEGT) initiative, which is designed to identify sustainable sources of timber coming into the EU.
“If this type of platform had existed when we were negotiating FLEGT, we would have been able to identify much more sharply the key actors from the private sector, as well as the key jurisdictions that have a stake in the trade between countries, and incentivize progress along the way,” he says, adding that good actors are already becoming dramatically more transparent.
“We’re seeing transparency becoming a competitive advantage,” he says. “We’ve struggled for so many years to try to convince the private sector to release more data on supply chains, but we’ve never had a complete picture.”
And that complete picture is critical, because transparency can be a double-edged sword, according to Rosa Maria Vidal, Executive Director of the Governors’ Climate and Forests Fund.
Use and Abuse: To Flee or to Fix?
Vidal says she’s a big believer in transparency, but she cautions that it can backfire if disclosure scares companies away from problematic municipalities instead of encouraging them to engage productively.
“We’re working to build new partnerships across 35 subnational jurisdictions responsible for 30% of the world’s deforestation,” she says. “These are jurisdictions that have promised to reduce deforestation 80% by 2020 by bringing benefits to communities, but they haven’t seen any finance yet.”
If the emerging transparency efforts shine a light on companies that are sourcing material from high-deforestation areas, she says, they should encourage those companies to actively improve conditions rather than pull up and move elsewhere.
“If we don’t facilitate this dialogue – if we just say, ‘It’s a risky jurisdiction’ – it will mean more deforestation because of fewer jobs and opportunity,” she says – and Gardner agrees.
“It’s unrealistic for all companies to just pick up and move to where there are no problems, and if they tried, no one would ever meet their commitments,” he says. “But companies often don’t even know their impacts, and this makes it possible for them to know where they need to invest.”
How it Works
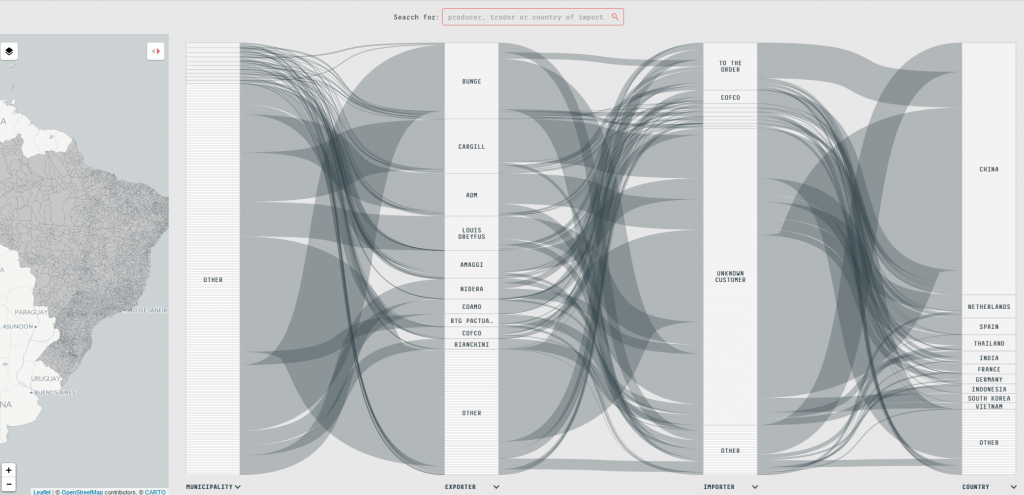
The address is www.trase.earth, and the portal offers introductory tutorials at the bottom of the page. Or you can click on “explore the tool” and see where your mouse takes you:
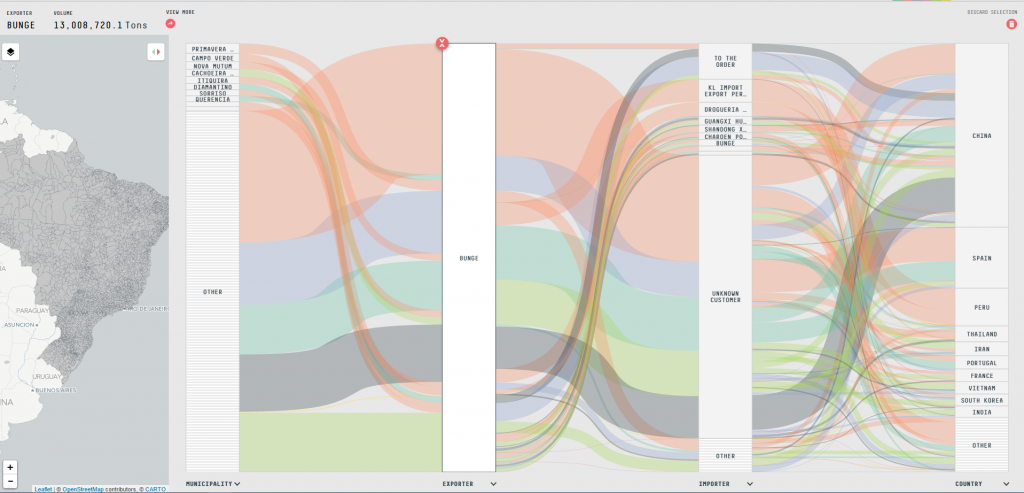
You can color code to highlight supply chains by various criteria – in this case, the type of biome from which the soybeans come:
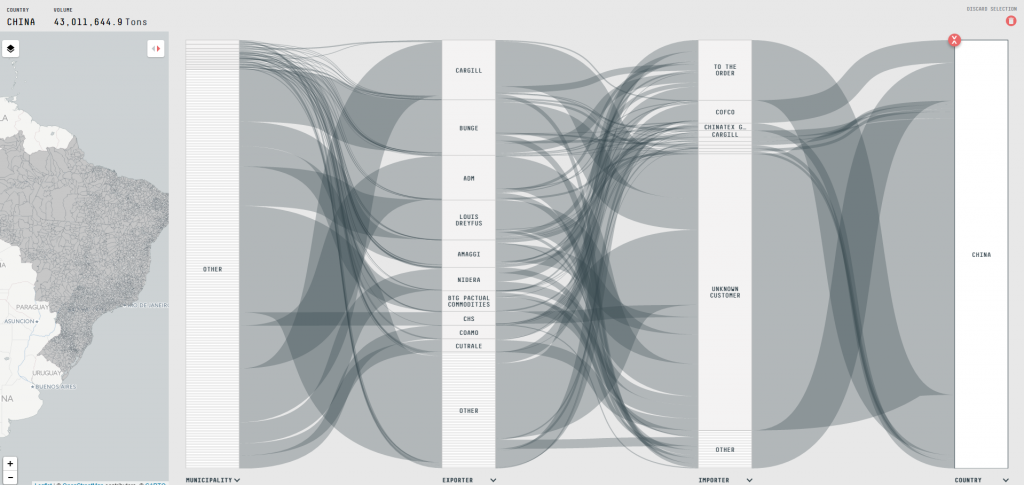
Or you can filter it to one or several countries – in this case, China:
Filter to one trader – Bunge – and you get this:
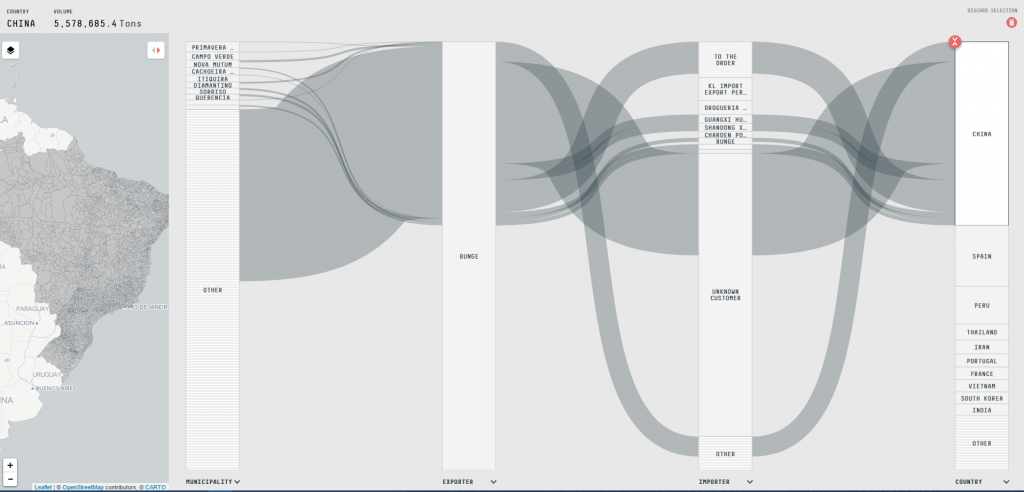
You can then reduce it to one importer – Guangxi – and you get this:
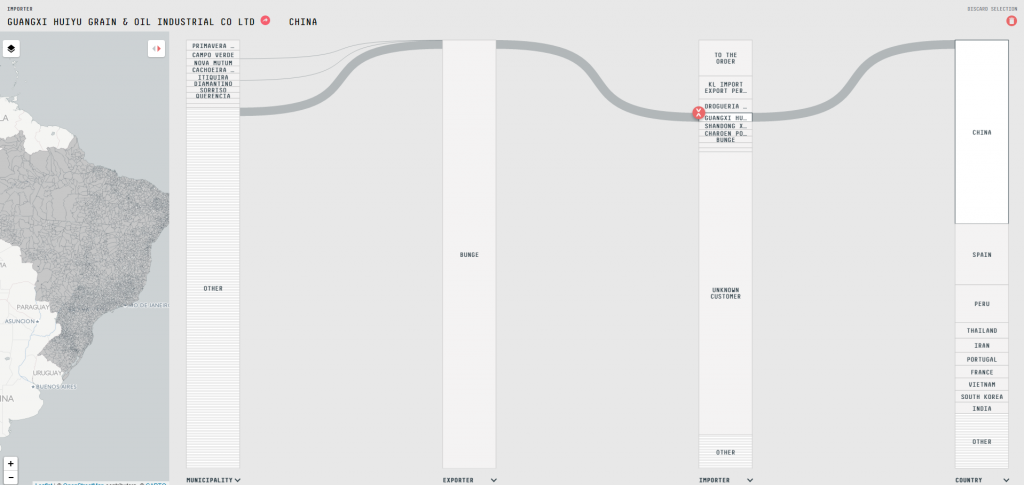
Finally, you can expand the municipality bar to see where Bunge gets the beans that it sells to Guangxi. In this case, hundreds of strings appeared, but we highlighted just four. The municipalities you select will show up on the map, and you can begin layering in factors like deforestation rates, reported rates of forced labor, and water scarcity.
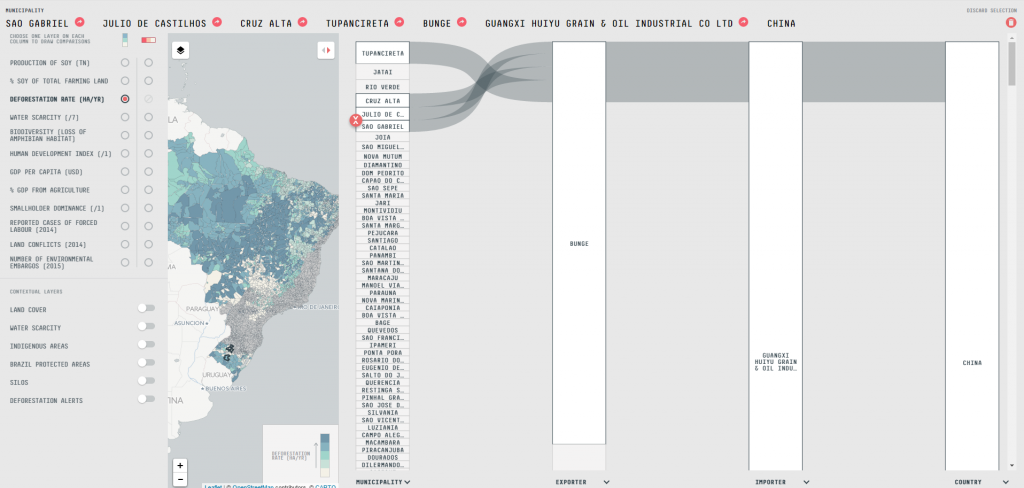
For now, TRACE includes 320,000 unique pathways, and that will increase exponentially as the portal grows to include other countries and commodities.
Please see our Reprint Guidelines for details on republishing our articles.

